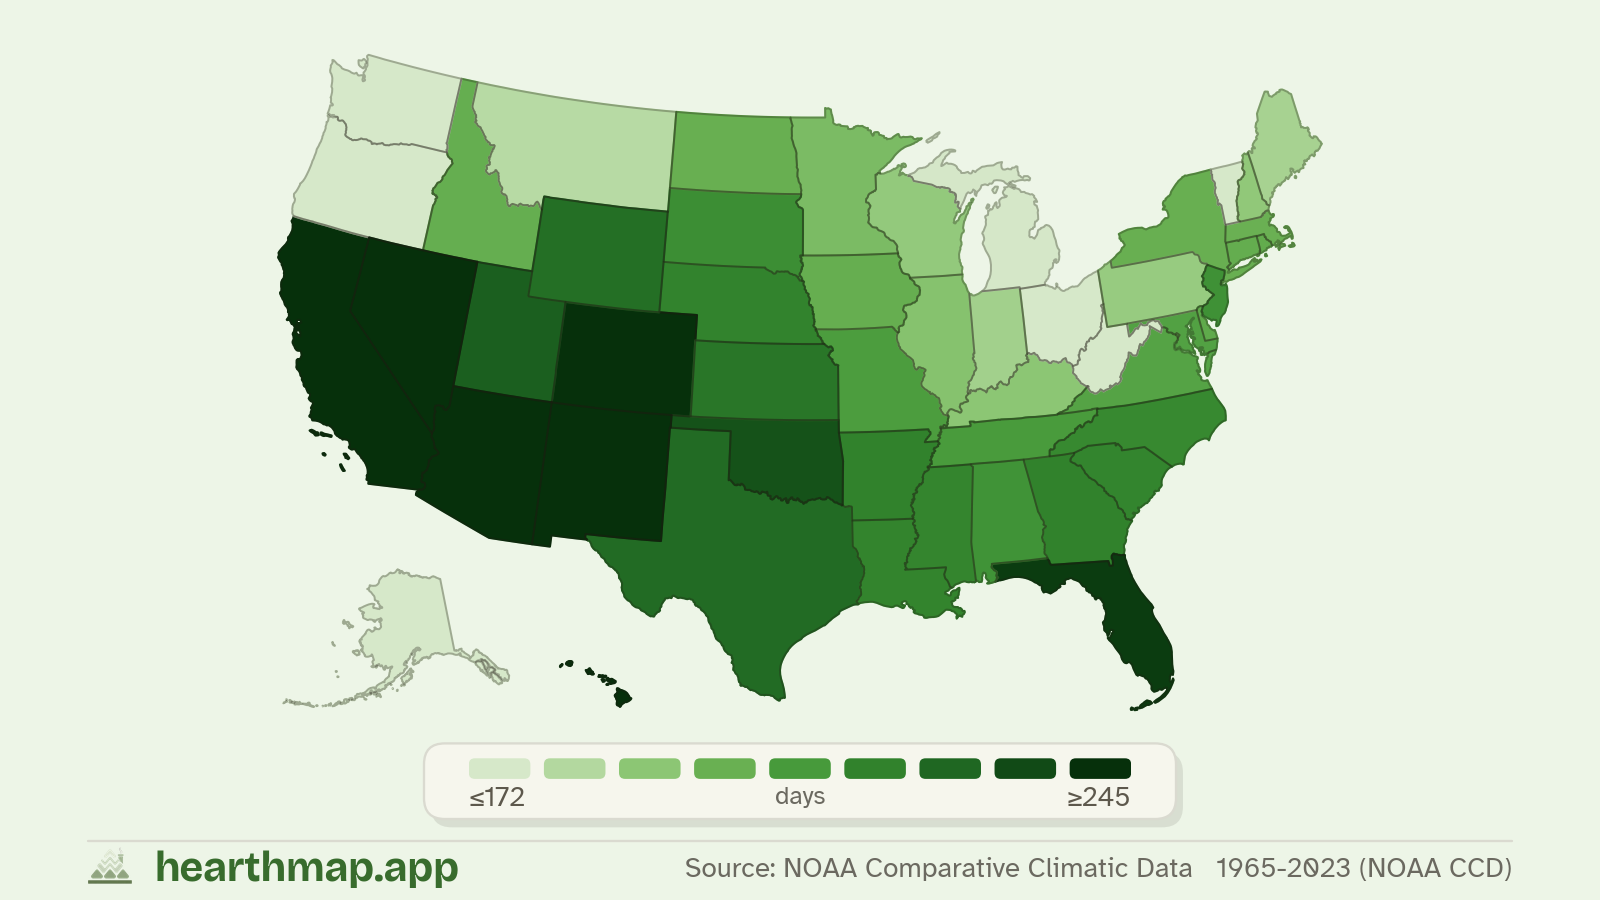
States ranked by sunny days per year
51 states with data (1965-2023 (NOAA CCD)). Ranked highest first.
| Rank | State | Value |
|---|---|---|
| 1 | Arizona | 292 days |
| 2 | Nevada | 281 days |
| 3 | New Mexico | 281 days |
| 4 | California | 273 days |
| 5 | Hawaii | 255 days |
| 6 | Colorado | 245 days |
| 7 | Florida | 241 days |
| 8 | Oklahoma | 233 days |
| 9 | Utah | 229 days |
| 10 | Texas | 225 days |
| 11 | Wyoming | 224 days |
| 12 | Kansas | 221 days |
| 13 | Arkansas | 217 days |
| 14 | Georgia | 217 days |
| 15 | Nebraska | 217 days |
| 16 | Louisiana | 217 days |
| 17 | South Carolina | 217 days |
| 18 | Mississippi | 216 days |
| 19 | North Carolina | 215 days |
| 20 | South Dakota | 213 days |
| 21 | New Jersey | 212 days |
| 22 | Alabama | 211 days |
| 23 | Tennessee | 208 days |
| 24 | Missouri | 207 days |
| 25 | Maryland | 205 days |
| 26 | Virginia | 204 days |
| 27 | Delaware | 202 days |
| 28 | District of Columbia | 202 days |
| 29 | Rhode Island | 201 days |
| 30 | Connecticut | 201 days |
| 31 | Idaho | 200 days |
| 32 | Iowa | 200 days |
| 33 | North Dakota | 200 days |
| 34 | New York | 200 days |
| 35 | Massachusetts | 199 days |
| 36 | Minnesota | 194 days |
| 37 | Illinois | 192 days |
| 38 | Kentucky | 190 days |
| 39 | New Hampshire | 189 days |
| 40 | Wisconsin | 189 days |
| 41 | Pennsylvania | 188 days |
| 42 | Indiana | 185 days |
| 43 | Maine | 184 days |
| 44 | Montana | 180 days |
| 45 | Michigan | 172 days |
| 46 | Ohio | 172 days |
| 47 | West Virginia | 166 days |
| 48 | Vermont | 163 days |
| 49 | Oregon | 157 days |
| 50 | Washington | 154 days |
| 51 | Alaska | 130 days |
- Category
- Environment
- Native level
- County
- Unit
- days
- Vintage
- 1965-2023 (NOAA CCD)
About this map
hearthmap renders sunny days per year as a choropleth map of the United States. Zoom in to see county values shaded against the rest of the country, and click any region to see its exact value with margin of error.
You can layer filters and a custom match score on top of sunny days per yearto find places that match what matters to you. Combine it with school ratings, housing prices, commute times, and more.
Source: NOAA Comparative Climatic Data · 1965-2023 (NOAA CCD)
Frequently asked questions
- Which US state has the sunniest sunny days per year?
- Arizona is the sunniest state, at 292 days.
- Which US state has the least sunny sunny days per year?
- Alaska is the least sunny, at 130 days.
- How is this ranking calculated?
- US states are ranked by sunny days per year (NOAA Comparative Climatic Data, 1965-2023 (NOAA CCD)), highest first.