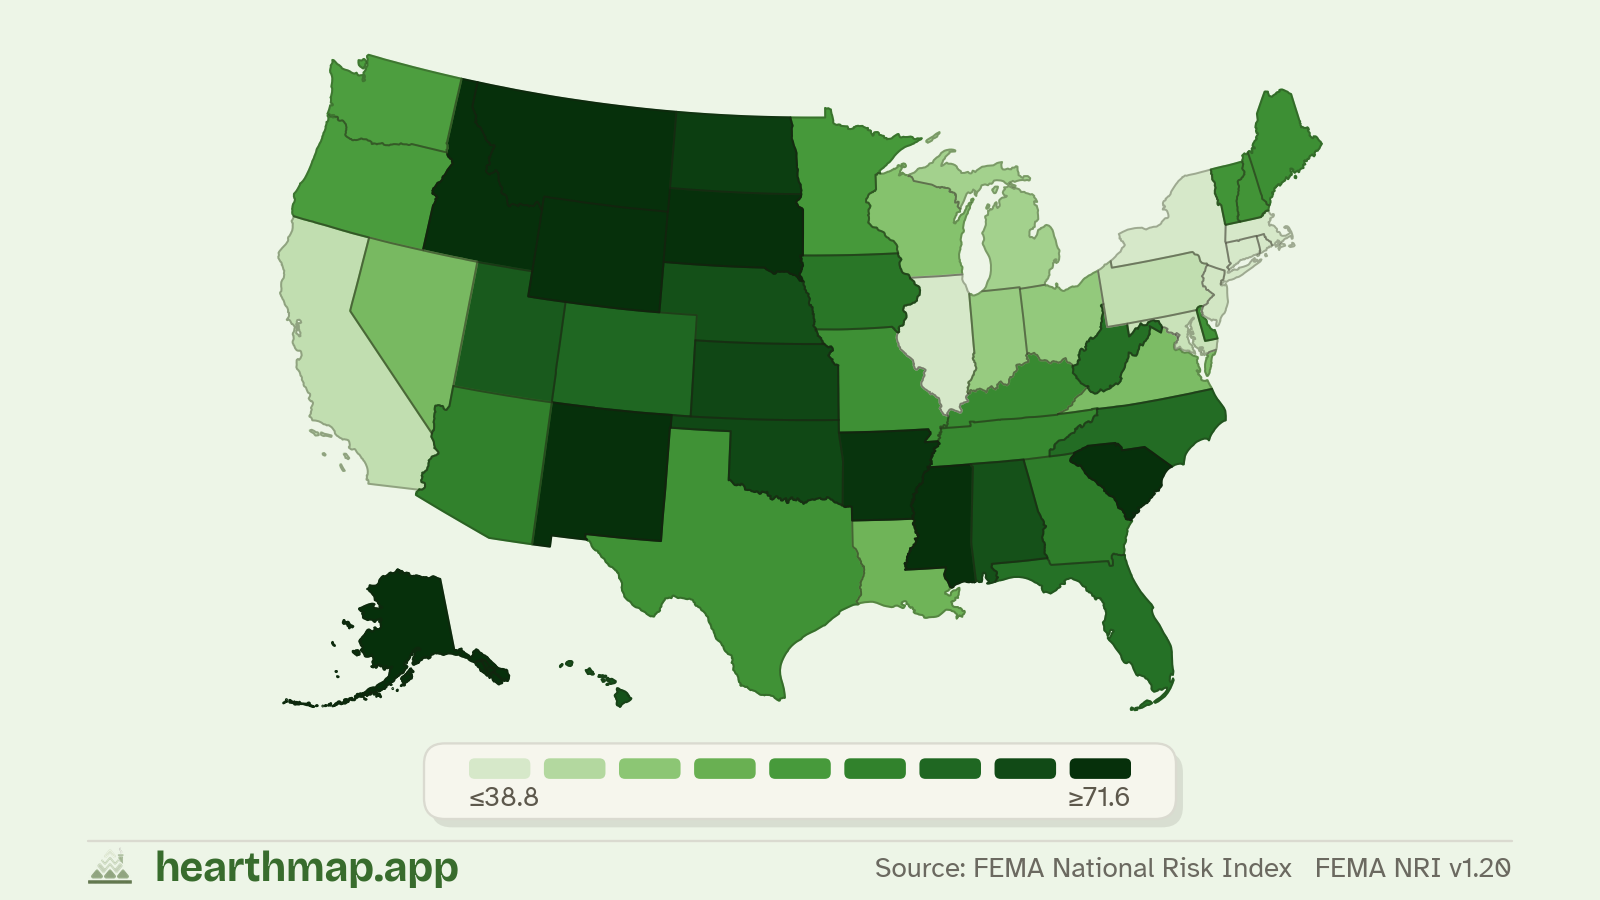
Lowest counties for wildfire risk in the United States
Top 25 of 3144 counties with data.
Ranked by wildfire risk (FEMA National Risk Index, FEMA NRI v1.20), lowest first.
Lowest counties for wildfire risk in the United States
| Rank | County | Value |
|---|---|---|
| 01 | County page | |
| 02 | Bronx, NY1.2 County page | |
| 03 | Kings, NY1.2 County page | |
| 04 | New York, NY1.4 County page | |
| 05 | Queens, NY2.2 County page | |
| 06 | Hudson, NJ3.4 County page | |
| 07 | County page | |
| 08 | Orleans, LA6.5 County page | |
| 09 | Suffolk, MA7.0 County page | |
| 10 | Cook, IL7.9 County page | |
| 11 | Essex, NJ9.1 County page | |
| 12 | St. Louis10.2 | |
| 13 | County page | |
| 14 | Jefferson, LA11.4 County page | |
| 15 | County page | |
| 16 | Passaic, NJ12.4 County page | |
| 17 | Richmond, NY14.2 County page | |
| 18 | Nassau, NY14.3 County page | |
| 19 | Union, NJ17.2 County page | |
| 20 | County page | |
| 21 | Bergen, NJ17.6 County page | |
| 22 | DuPage, IL18.1 County page | |
| 23 | Los Angeles, CA19.7 County page | |
| 24 | Rockland, NY19.9 County page | |
| 25 | Milwaukee, WI20.8 County page | |
How this ranking works
This page ranks every US county by wildfire risk, sorted so the lowest places appear first. Click any county to see its housing, schools, crime, and demographics in detail.
For wildfire risk, a lower value is generally more favorable, so the top of the list is the lowest. Want to weigh wildfire risk against schools, taxes, commute, and more at once? Use the live map to build a custom match.
Data comes from public sources. Source attribution and the exact data vintage are shown above and on the full map of wildfire risk.
Frequently asked questions
- Which US county has the lowest wildfire risk?
- Aleutians West, AK has the lowest wildfire risk in the United States, at 0.0.
- What is the wildfire risk in Aleutians West, AK?
- Aleutians West, AK is ranked #1 in the United States for wildfire risk, at 0.0.
- What are the top US counties for wildfire risk?
- Aleutians West, AK (0.0), then Bronx, NY (1.2), and Kings, NY (1.2). The full top 25 is in the table on this page.
- How is this wildfire risk ranking calculated?
- Counties in the United States are ranked by wildfire risk (FEMA National Risk Index, FEMA NRI v1.20), lowest first. Values describe the county, not an individual property. Source vintage is shown on the page.
Related
Lowest Wildfire Risk Counties in the US, state by state
The same ranking, scoped to a single state.
- Alabama
- Alaska
- Arizona
- Arkansas
- California
- Colorado
- Connecticut
- Delaware
- District of Columbia
- Florida
- Georgia
- Hawaii
- Idaho
- Illinois
- Indiana
- Iowa
- Kansas
- Kentucky
- Louisiana
- Maine
- Maryland
- Massachusetts
- Michigan
- Minnesota
- Mississippi
- Missouri
- Montana
- Nebraska
- Nevada
- New Hampshire
- New Jersey
- New Mexico
- New York
- North Carolina
- North Dakota
- Ohio
- Oklahoma
- Oregon
- Pennsylvania
- Rhode Island
- South Carolina
- South Dakota
- Tennessee
- Texas
- Utah
- Vermont
- Virginia
- Washington
- West Virginia
- Wisconsin
- Wyoming
Get the monthly digest
One email a month: fresh rankings, new datasets on the map, and a few interesting county data finds.
No spam, one-click unsubscribe, and we never share your address.